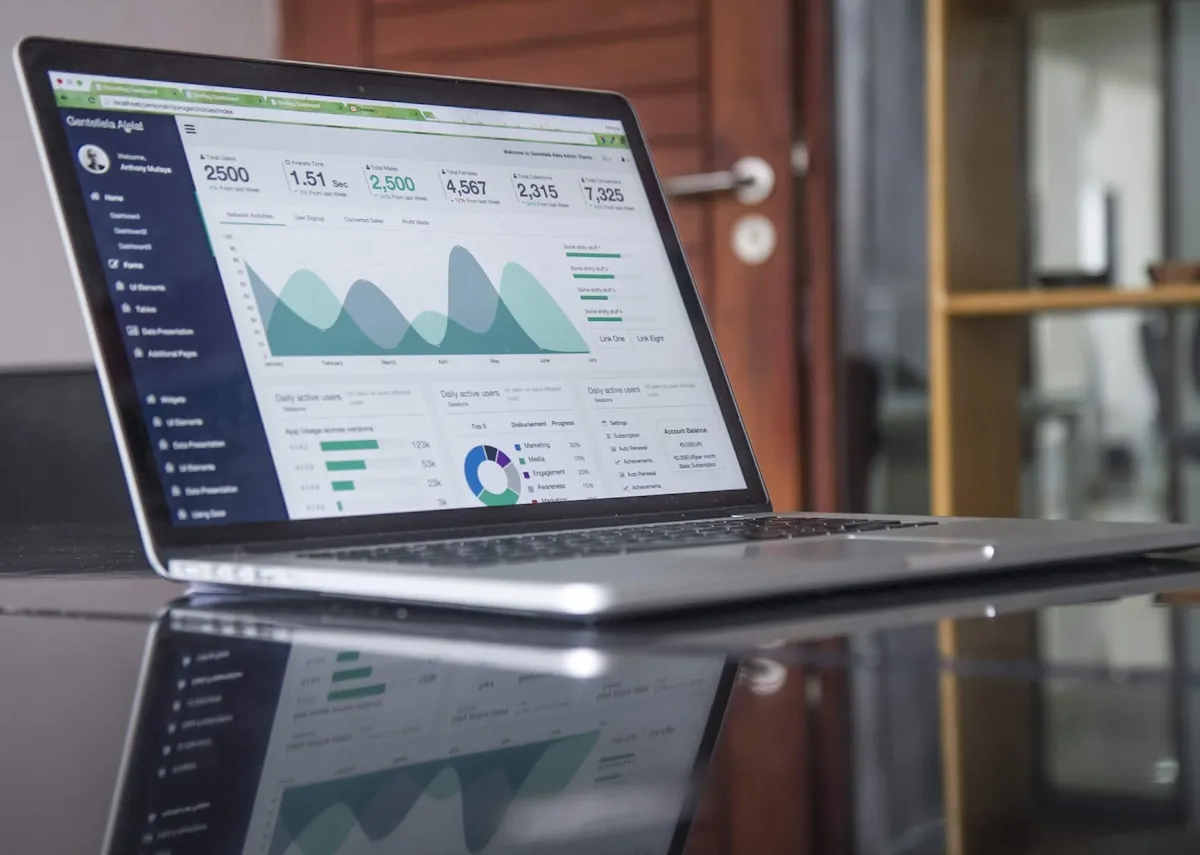
Strategic Business Intelligence Dashboard
Stop guessing and start knowing. Qrave's analytics suite transforms raw data into actionable insights, providing real-time tracking of revenue, hourly sales breakdowns, inventory waste, and customer flow heatmaps.
Everything you need to succeed
Profitability Matrix Categorization
We automatically map your menu onto a Boston Consulting Group matrix. Instantly identify your Stars (high profit, high volume) and your Dogs (low profit, low volume) to optimize your offerings.
- Menu engineering made automatic
- Identify invisible profit leaks
- Data-driven pricing decisions

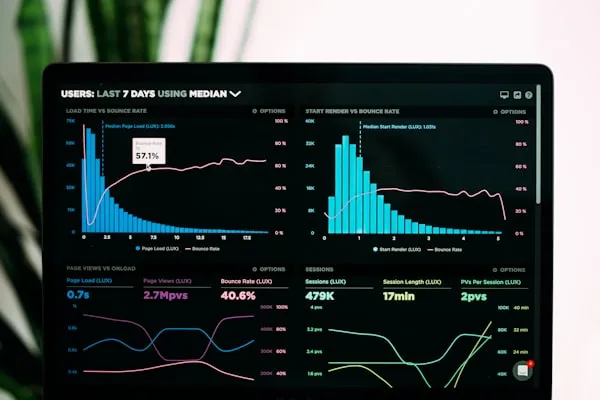
Live Heatmaps & Peak Tracking
Visualize your restaurant's busiest hours across the week. Accurately forecast rushes, optimize your kitchen prep, and schedule staff with pinpoint accuracy saving labor costs.
- Optimize shift scheduling
- Track average ticket times during peaks
- Analyze weather vs. sales correlations

Customer Retention Metrics
Understand who is coming back. Track guest return rates, average lifetime value, and most ordered items by cohort to build highly targeted loyalty campaigns.
- Identify your most valuable regulars
- Track VIP spend over time
- Measure loyalty program success
Ready to modernize
your restaurant?
Join hundreds of restaurants providing a seamless digital experience.
Build, brand, and launch in as little as 2 minutes.